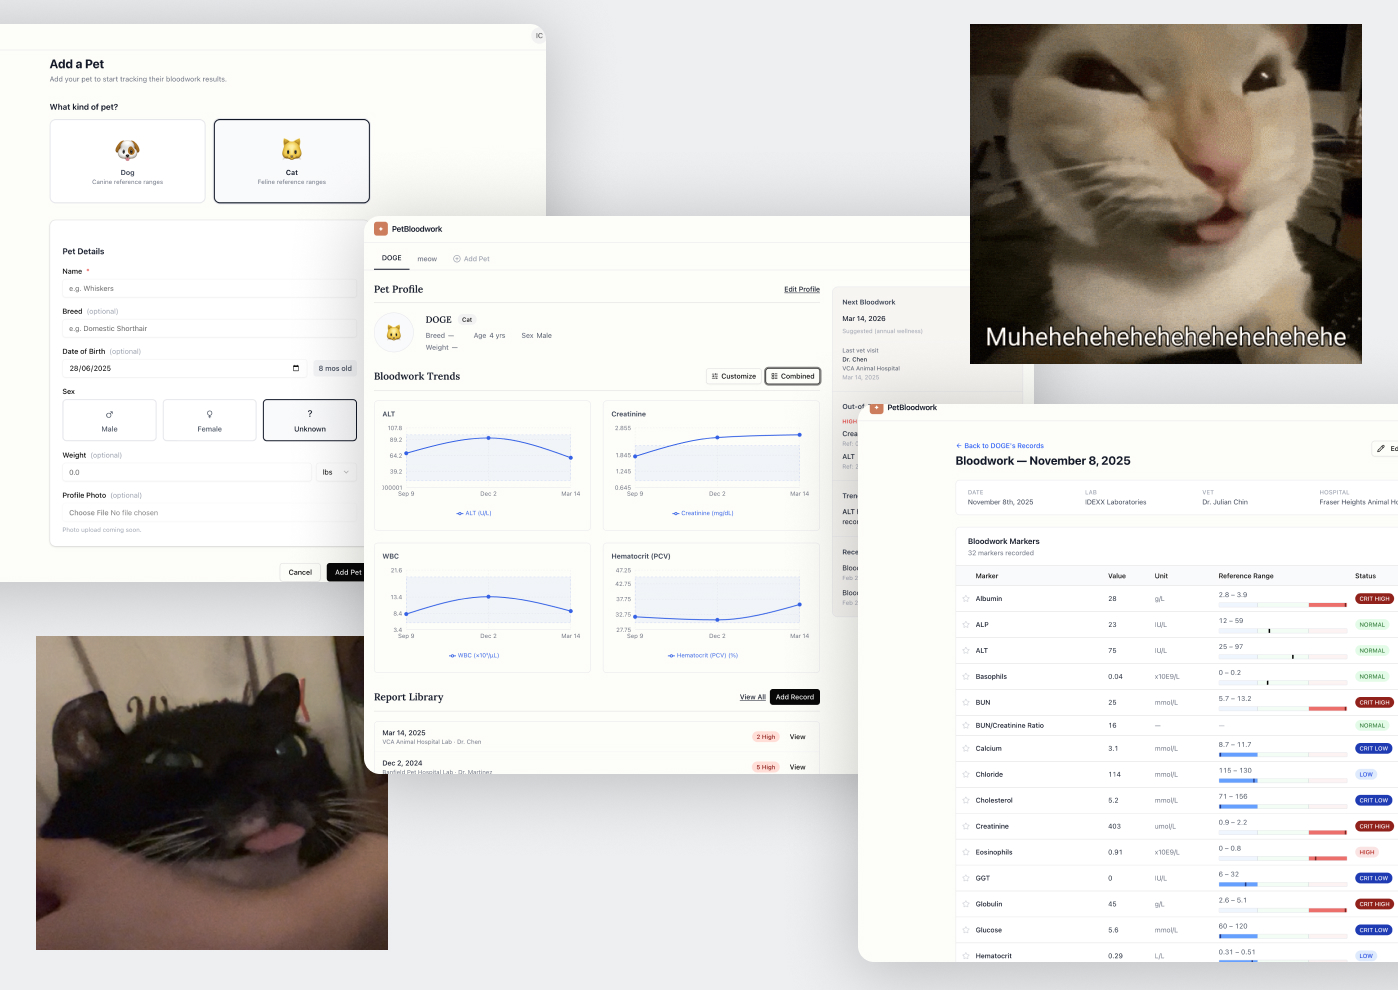
What it is
This project started with my cat, DOGE, and a chronic kidney disease diagnosis. Suddenly I was tracking bloodwork every few weeks: creatinine, BUN, phosphorus, values I’d never had to think about before.
- DOGE, the reason this project exists.
- The diagnosis meant regular bloodwork from here on, and a growing stack of paper reports to make sense of.
I tried to make sense of it myself first. Every result went into a spreadsheet, then a Notion database, so I could at least see it all in one place.
It didn’t work:
- I didn’t know what half the medical terms and abbreviations meant
- The numbers were just numbers to me, and I couldn’t tell whether anything was actually changing
- Excel and Notion’s charts were flat, with no reference ranges and no sense of what “normal” looked like
- Our vet visits split between Hong Kong and Canada, and the two labs report the same markers in different units, so nothing lined up
- My first attempt: a spreadsheet and a Notion board, updated by hand after every vet visit. Technically a record, but not something I could read.
So I turned to AI chat directly, pasting lab PDFs into Claude and ChatGPT and asking what I was looking at.
That was better, but still not it:
- Genuinely good at explaining what a marker like BUN or Creatinine meant, the moment I asked
- But every answer came back free-form: a wall of text, structured differently each time
- It could sketch a small chart if I pushed for one, but never a real overview across all my records
- And no way to build the one thing I actually needed: a reference-range bar showing exactly where a value sat
- My second attempt: asking AI chat directly. Great at explaining a single value on request, useless at giving me the shape of the whole picture.
That gap, an AI that can explain the data but can’t turn it into a dashboard, is what PetBloodwork closes. Upload your lab reports, log 50+ biomarkers, and watch how the values trend across visits. It flags anything that drifts outside the healthy range, or a follow-up that’s due.
Core features:
- Multi-pet profiles (Cat and Dog for MVP), each with their own full history
- Trend charts per biomarker, with reference range bands overlaid
- Out-of-range markers and trend alerts: “ALT has been trending high across the last 3 records”
- A side panel with the next bloodwork date, last vet visit, weight snapshot, and recent activity
- PDF-to-data automation: upload a lab report and Claude extracts the markers
Stack: Next.js 14, Tailwind, shadcn/ui, Prisma, NextAuth, Supabase, Claude API
I built it to find out how far I could take a product on my own, directing an AI collaborator through a full cycle the way a PM directs a team. That meant owning the database and the API wiring as well as the screens, and spending enough UX judgment on it that the result feels considered instead of reading like the default an LLM reaches for.
Directing Claude like a product manager
Starting with a sitemap (but not in Figjam)
As a product designer, I always start with a sitemap. It’s how I get the overview and understand the overall function of the product. I used to do it in Figjam. This time I asked Claude to build one for me.
What came back was surprisingly thorough: pet-centric routing under /pets/:petId, separate sections for Records (structured data) vs Reports (uploaded PDFs and vet notes), Trends as its own standalone page, and customisable reference ranges in Settings. The structure made sense.
I reviewed it the way I’d review a junior designer’s homework, comment by comment. Then I told Claude what I’d change.
- Claude's first sitemap draft, before any of my feedback.
- My line-by-line review next to Claude's plan, marked up like a junior designer's homework.
- Claude's response: incorporating the feedback and kicking off research on medical reference ranges.
Micromanagement, with no regret
I pushed back on almost everything:
- Landing page: no marketing page, just a login/sign-up box on the left and product info in infographic style on the right
- Dashboard: tab-style pet switcher, 70/30 layout with charts left and the side panel right, the highlighted chart visible immediately
- Empty states: always show the Add Pet or Add Report CTA so the user knows what to do
- Reference ranges: seed defaults from IDEXX laboratories and the Merck Veterinary Manual, with per-pet overrides and a reset button
I noticed Claude hadn’t mentioned any medical standards in the plan. So I gave it more context, IDEXX laboratories, and asked it to research the reference ranges online. Claude asked my permission before fetching, to confirm it was looking at the right source. I said yes. It pulled from both IDEXX and the Merck Veterinary Manual and came back with the full CBC and Chemistry panel tables for Dog and Cat.
- Claude researching IDEXX and Merck Veterinary Manual reference ranges in real time.
- The resulting CBC and Chemistry panel tables, seeded as the app's defaults.
With other designers, I worry about being too prescriptive and pushing my ideas onto someone else’s work. With Claude I micromanaged happily. The directing and redirecting worked the same product management muscle, just pointed at an AI.
- Claude asking a clarifying question mid-plan instead of guessing: which additional metadata cards did I actually want?
- Claude's own summary of what it changed based on my review, before writing any code.
Full-stack execution
This is the part that used to stop at a handoff. Here I was the one holding the codebase, frontend and backend and database and the API integration, with Claude as the engineer executing what I decided.
Day 1 — struggle till late night
After confirming the structure, Claude broke the build into 10 coding tasks and started scaffolding: Next.js 14 with Tailwind and shadcn/ui, Prisma schema, NextAuth, all the pages.
- The 10-task breakdown Claude scoped out before writing any code.
Then I hit a wall. Every time I logged in, I got a page error. I tried screenshotting and asking Claude to check the logs. It kept pointing me to the wrong place and suggesting the wrong action.
Eventually I gave up and decided to sleep and fix it tomorrow.
Day 2 — one wrong letter
I opened Claude and asked it to recheck the whole codebase. After more testing, I had a feeling it was database-related.
Following a new round of instructions, I checked my Supabase linkage and the .env file. Found it: one letter in the Supabase key was wrong, or maybe it was the wrong version of the key.
After updating it, the whole product just appeared in front of me.
Hapiiiii.
The $5 feature
At some point I remembered the core thing I actually wanted to build: PDF to data automation. Instead of manually entering every marker after a vet visit, you upload the lab report and the app extracts everything.
I bought $5 of Claude API credits, added the key to my .env file, and asked Claude to wire it up.
There were bugs. Data type mismatches. Invisible invalid inputs. Each time: copy the error log, paste it to Claude, ask it to fix it.
Eventually it worked. Upload a PDF → data extracted → markers auto-filled → trend chart updated.
- Attaching a lab report PDF to a new bloodwork record.
- The PDF attached and ready, one click from extraction.
- Claude's extracted markers, auto-filled into the review form before saving.
- The saved record: severity automatically flagged from the values Claude pulled off the PDF.
Then, the most expensive feature released! (5 usd!!!)
None of that was UI work: the database, the auth, the API wiring, the bug fixing. It’s the backend half of the product, and I own it.
UX judgment: why it doesn’t look AI-generated
The first version worked. It also looked exactly like what it was: AI-generated. Plain, boring, with some strange UX flows that made me uncomfortable.
- This is what it looked like when it was born: functional, and unmistakably AI-generated.
I’m a visual person. I couldn’t stop wanting to fix button styles, label spacing, colour hierarchy. But I knew if I just sent Claude corrections one at a time, we’d go back and forth forever.
So I asked Claude to study brands that publish their design systems openly (Uber, Apple, Microsoft, Anthropic), write a design.md before touching anything, and make the changes on a branch.
What I took away: Claude doesn’t fully absorb a design style on its own. It still needs someone to point at the patterns, like background colour leveling, CTA hierarchy, and what “primary” means in this context. It picks them up fast once you explain them; it just won’t get there by itself.
- My actual UX review comments, laid directly over the working product, page by page.
8 hours of polishing
After setting the design direction, I spent around 8 hours going through the product and adding the human touch:
- Data display: colour-coded HIGH/NORMAL/CRIT HIGH statuses, a font size hierarchy for values, inline sparklines in table rows, and the ability to pin the markers that matter
- Contextual annotations: tooltips explaining each marker in plain language, e.g. “Urea nitrogen filtered by the kidneys. High levels may mean kidneys are struggling.”
- The “Add Pet” onboarding form: card-style species selector, calculated age shown after DOB input, a three-card sex selector (Male / Female / Unknown) in place of a dropdown
- Mobile responsive: animations, transitions, tap targets
- Interactivity: hover and click anywhere on a table row to open the detail page, rather than aiming at a small “View” button
Claude executed every one of these, but I had to know what to ask for. That’s the part that separates a demo from something a person would actually keep using.
- Before: a checkbox list to build the trend chart, and six separate cards running down the sidebar. After: a 2x2 chart grid with a Combined/Customize toggle, and every sidebar card consolidated into one panel, so there's no more "Weight — No weight recorded" taking up space with nothing to show.
- Before: a bare table with marker, value, unit, a plain reference range, and a flat NORMAL/HIGH badge. After: reference-range bars, a CRIT HIGH/CRIT LOW severity tier, and favourite stars on the markers that matter most for this pet.
- One of the contextual tooltips, next to the three markers pinned as favourites for this pet.
What this changed about how I work
PetBloodwork is the first working product I’ve built this way, and the speed is what I keep coming back to. Something that used to be a Figma file and a long conversation with an engineer was a running app with a real database behind it in a couple of days. I find that genuinely exciting, and a little disorienting.
The ceiling shows up fast, though. What an AI produces on its own is competent and generic, and the first version of this app is a fair example: everything worked, nothing was broken, and it looked like every other LLM-built dashboard. All 50 markers sat on the screen with equal weight and no sense of which ones mattered. I open that page with one question, which is whether DOGE is holding steady, and nothing in the interface was answering it.
Domain knowledge is what closes that. I had spent months being the confused person holding the lab report, so I knew what to change: a severity tier in place of a flat NORMAL/HIGH badge, plain-language tooltips on markers most owners have never heard of, and the option to pin the handful of values I actually watch for DOGE. None of it was hard to build. It took around 8 hours on top of a build that took days, and Claude wrote all of it. The work was knowing which 8 hours to spend.
That ratio is what I’d tell another designer. Getting the machine feel out of an AI-generated product doesn’t take a rebuild. It takes a short list of decisions that someone has to know to make, and the model won’t arrive at them on its own.
So I expect the split to get sharper from here. Producing the thing stops being the expensive part, and knowing what it should be stays expensive. Technology on its own gets you a working generic product; paired with someone who knows the domain, it gets you one people want to keep using. For me it already means less time making screens and more time on the judgment calls that tell a fast collaborator what to make, and I think that’s what the design workflow looks like from here.
What I’m still figuring out
Product:
- How to increase accuracy when extracting data from PDF lab reports
- Whether I can feed medical research papers to give the app AI-generated health suggestions
- How to do proper UAT across edge cases (empty states, uploaded reports, out-of-range combinations)
- Whether this becomes a mobile app
Execution (the non-design side I’m still learning):
- What happens if I run out of tokens mid-plan, or forget to push to git?
- What’s actually the difference between
bunandnpm? - I don’t have a separate frontend folder in this project. Is that normal?
- If I want to eventually ship this as a real app, what should I be thinking about first?